Tutorial 1: Propagate Traces
With this tutorial you can solve the problem of distributed tracing
You have applied the Microservice architecture pattern. Requests often span multiple services. Each service handles a request by performing one or more operations, e.g. database queries, publishes messages, etc.
PyMS injects a unique request ID with opentracing and passes the external request id to all services that are involved in handling the current request with the service request
1. Simple Trace
-
Install PyMS
bash pip install py-ms[all] -
Create a config file with traces and requests enabled config.yml:
pyms:
  services:
    requests:
      propagate_headers: true
    tracer:
      client: "jaeger"
      host: "localhost"
      component_name: "Python Microservice"
  config:
    debug: true
main.py
from flask import jsonify, current_app, request

from pyms.flask.app import Microservice

ms = Microservice()
app = ms.create_app()


@app.route("/")
def index():
    app.logger.info("There are my headers: \n{}".format(request.headers))
    return jsonify({"main": "hello world {}".format(current_app.config["APP_NAME"])})


if __name__ == '__main__':
    app.run()
Run this script with:
python main.py
In another terminal, run this command:
curl 'http://localhost:5000/'
{
  "main": "hello world Python Microservice"
}
Your script main.py return a log like:
{
    "message": "There are my headers: \nHost: localhost:5000\r\nUser-Agent: curl/7.58.0\r\nAccept: */*\r\n\r\n",
    "timestamp": "2020-03-14T10:31:55.430289Z",
    "severity": "INFO",
    "service": "python microservice",
    "trace": "90999056092ac078",
    "span": "d7e15e52c8c27214",
    "parent": ""
}
2. Propagate Trace
Create a second script with this config and this code in main.py
pyms:
  services:
    requests:
      propagate_headers: true
    tracer:
      client: "jaeger"
      host: "localhost"
      component_name: "Python Microservice"
  config:
    debug: true
main.py
from flask import jsonify, current_app, request

from pyms.flask.app import Microservice

ms = Microservice()
app = ms.create_app()


@app.route("/")
def index():
    app.logger.info("There are my headers: \n{}".format(request.headers))
    response = app.ms.requests.get("http://localhost:5000/")
    return jsonify({"response": response.json()})


if __name__ == '__main__':
    app.run(port=5001)
Now, run both this script and the first script. You should have the first one running on http://localhost:5000/ and this new one on
http://localhost:5001/
In another terminal, run this command:
curl 'http://localhost:5001/'
{
  "main": "hello world Python Microservice"
}

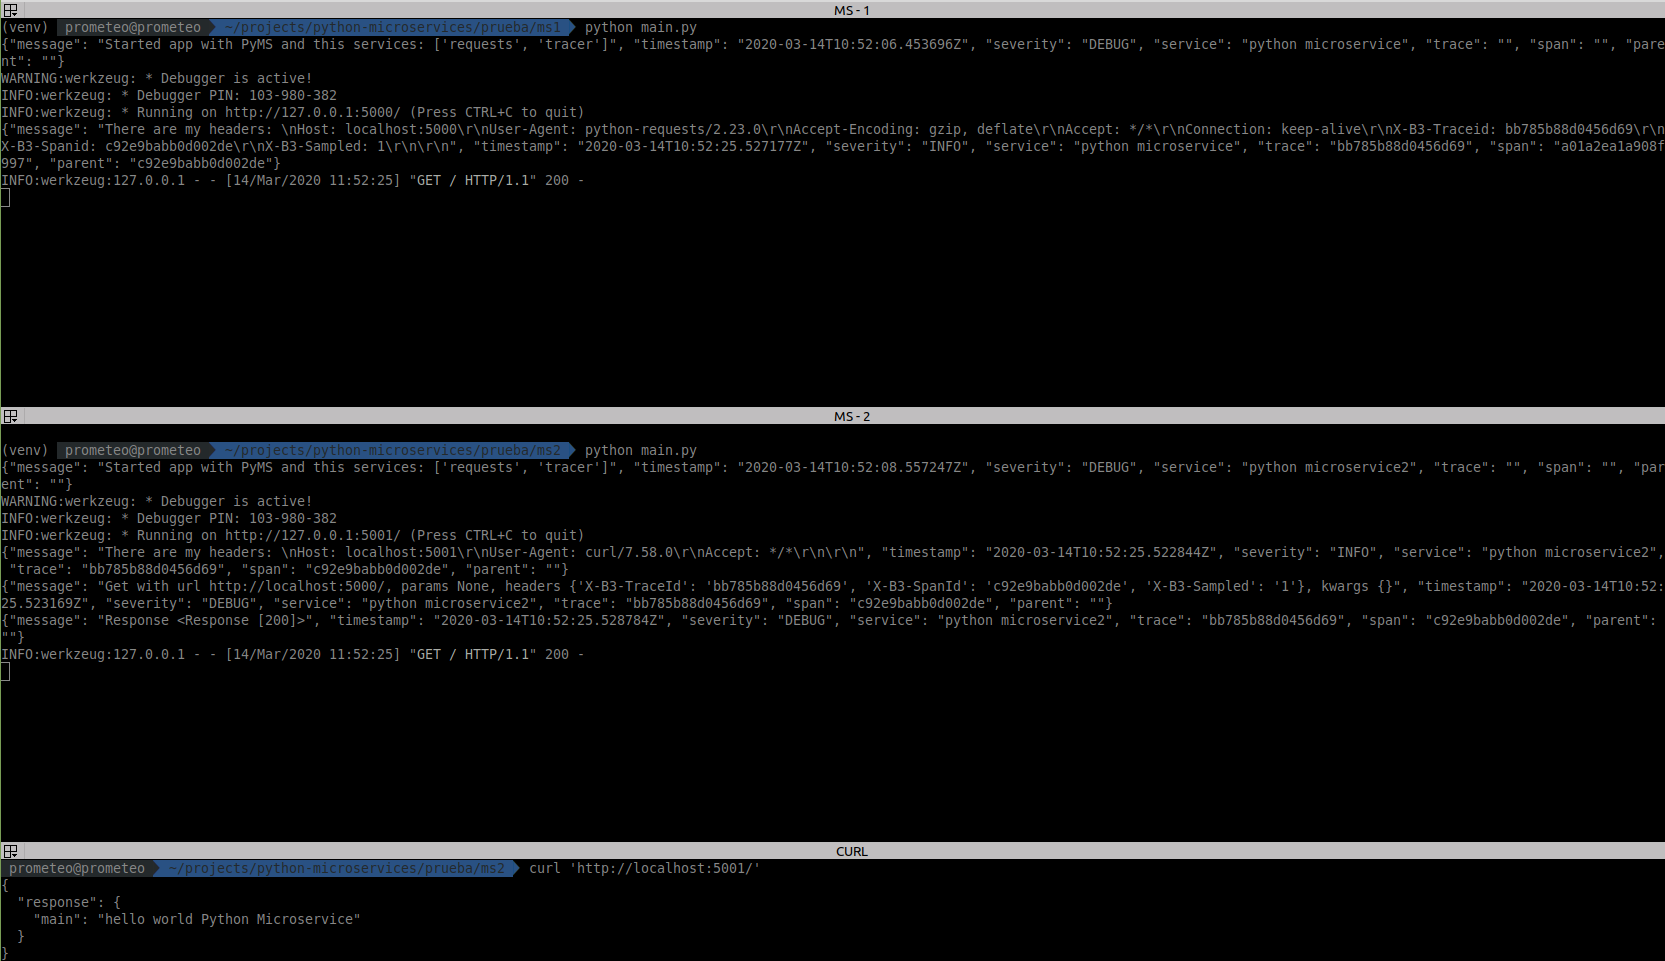
The second MS will print these logs:
{"message": "There are my headers: \nHost: localhost:5001\r\nUser-Agent: curl/7.58.0\r\nAccept: */*\r\n\r\n",
"timestamp": "2020-03-14T10:52:25.522844Z",
"severity": "INFO",
"service": "python microservice2",
"trace": "bb785b88d0456d69",
"span": "c92e9babb0d002de",
"parent": ""
}
{"message": "Get with url http://localhost:5000/, params None, headers {'X-B3-TraceId': 'bb785b88d0456d69', 'X-B3-SpanId': 'c92e9babb0d002de', 'X-B3-Sampled': '1'}, kwargs {}",
"timestamp": "2020-03-14T10:52:25.523169Z",
"severity": "DEBUG",
"service": "python microservice2",
"trace": "bb785b88d0456d69",
"span": "c92e9babb0d002de",
"parent": ""}
{"message": "Response <Response [200]>",
"timestamp": "2020-03-14T10:52:25.528784Z",
"severity": "DEBUG",
"service": "python microservice2",
"trace": "bb785b88d0456d69",
"span": "c92e9babb0d002de",
"parent": ""}
And the first MS return:
{"message": "There are my headers: \nHost: localhost:5000\r\nUser-Agent: python-requests/2.23.0\r\nAccept-Encoding: gzip, deflate\r\nAccept: */*\r\nConnection: keep-alive\r\nX-B3-Traceid: bb785b88d0456d69\r\nX-B3-Spanid: c92e9babb0d002de\r\nX-B3-Sampled: 1\r\n\r\n",
"timestamp": "2020-03-14T10:52:25.527177Z",
"severity": "INFO",
"service": "python microservice",
"trace": "bb785b88d0456d69",
"span": "a01a2ea1a908f997",
"parent": "c92e9babb0d002de"}
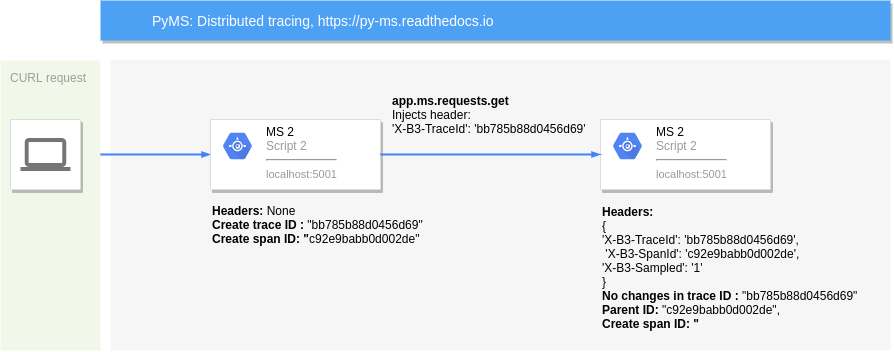
As you can see, both microservices have "trace": "bb785b88d0456d69".
Flow
You can see the flow of these requests in this diagram:

Code
You can check this example on this Github page
The simplest way to start the all-in-one is to use the pre-built image published to DockerHub (a single command line).
Tracer server
You can see the traces with jaeger server:
$ docker run -d --name jaeger \
  -e COLLECTOR_ZIPKIN_HTTP_PORT=9411 \
  -p 5775:5775/udp \
  -p 6831:6831/udp \
  -p 6832:6832/udp \
  -p 5778:5778 \
  -p 16686:16686 \
  -p 14268:14268 \
  -p 14250:14250 \
  -p 9411:9411 \
  jaegertracing/all-in-one:1.20
You can then navigate to http://localhost:16686 to access the Jaeger UI.